Grafana OSS is the leading open-source platform for visualization and observability. It enables teams to query, visualize, alert on, and explore telemetry data from multiple sources in a single interface. With support for 100+ data source plugins—including Prometheus, Loki, Elasticsearch, InfluxDB, SQL/NoSQL databases, and OpenTelemetry—Grafana helps teams correlate metrics, logs, and traces across applications and infrastructure. Users can build interactive dashboards with rich visualizations, template variables, and reusable panels to monitor systems and troubleshoot issues in real time. Grafana includes capabilities such as ad hoc data exploration, alerting, annotations, and flexible query support. Its extensible plugin ecosystem integrates with cloud platforms, databases, and developer tools—allowing teams to build observability workflows without vendor lock-in. The easiest way to get started with Grafana is with Grafana Cloud, our fully managed, full-stack observability platform.
Features
- Completely open source under the AGPL-3.0 license
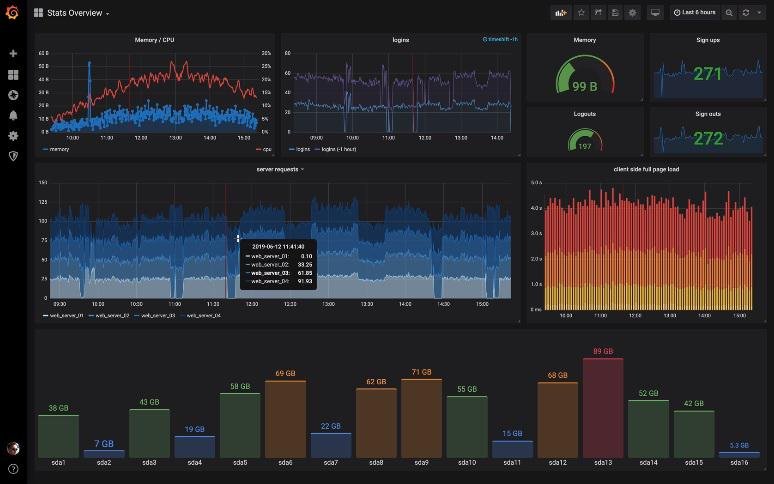
- Flexible dashboards and rich data visualizations for observability
- Connects to 100+ data sources including Prometheus, Loki, Elasticsearch, and InfluxDB
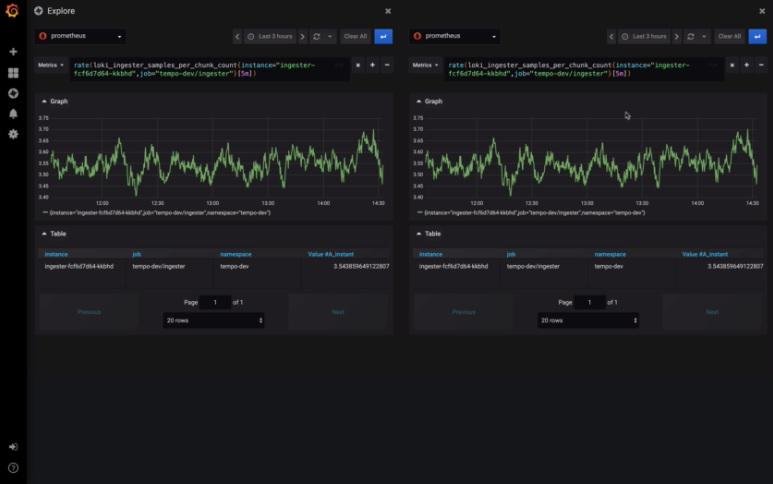
- Unified exploration of metrics, logs, and traces
- Prometheus-native metrics visualization and querying
- Native support for OpenTelemetry and open observability standards
- Real-time alerting with flexible rule management
- Dynamic, reusable dashboards with variables and filters
- Extensible platform with hundreds of official and community plugins
- Mixed data source queries across multiple systems
- Ad-hoc queries and interactive data exploration
- Shareable dashboards, panels, and snapshots
- Interactive graph annotations and time-range comparisons
- Templating for multi-environment and multi-tenant deployments
- Explore telemetry across metrics, logs, traces, and profiles
- Monitoring for distributed systems and microservices
- AI and machine learning model monitoring through integrations
- Monitor AI and LLM applications using OpenTelemetry telemetry
- Custom plugin development using Grafana’s extensible plugin SDK
Project Samples